Are you wanting to know how well your Google My Business page is performing? Do you have any idea of how many views and clicks your page is getting? If you spend a lot of time in your Google My Business account you will know that Google allows you to see some insights for your page, these insights can be extremely useful and can help track how your page is performing. In this article I will be discussing the insights you need to be taking note of and what they mean for your page. I will also be telling you each step you need to take if you are unfamiliar as to where the insights are and how to access them.
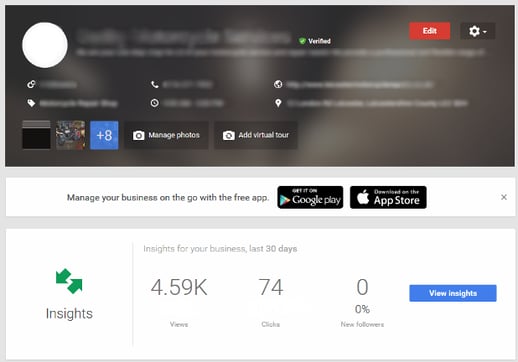
The first step that you need to take is to navigate yourself to your My Business dashboard. The easiest way to get there is to sign into your Google account and then search 'Google My Business' on Google and click on the first link. Here is what you can expect your dashboard to look like. You next want to click 'View Insights' once you get to this page:
Once you have clicked on the 'View Insights' button you will then be taken to a page where you will find each of the below headings. I will now discuss what you need to took for under each heading and how it can help show how well your page is performing.
Views
Under the views section, Google will show you a graph similar to the the below image, depending on the date range you select will depend on what information shows.
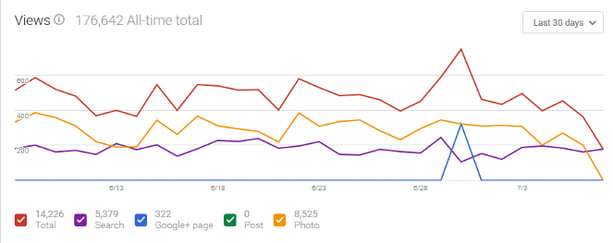
This is then broken down into 5 sub sections;
Total – This is the total number of views your Google My Business page has received. Whether that has been from a Google Search result, your actual Google+ page, a Google+ post or a photo on your page.
Search – This is the number of times people have seen your business information show up on Google. This can come from Google Maps (desktop and mobile) and normal Google Searches.
Google+ page – This is the number of times people have seen your business’s Google+ page.
Post – This is the number of times people have seen your posts from your business’s Google+ page.
Photo – This is the number of impressions your Google+ photos have had across Google. This can include from Google+, Google Search results, Google Image Searches and Google Maps.
All this data from Google is great as it means you can see what areas of your Google account are getting the most views. If you can see that you are not receiving any views from Google+ posts then this shows you simply need to start posting more on your Google+ page! If you're not receiving any views from photos, then this shows you need to upload more photos to your page. The best thing to do is regularly check your views and keep a record of what they are each month. This way you can start to track how many views you are getting and you want to try to improve this every month!
Clicks
The next section is clicks, again Google will show you a graph similar to the the below. Depending on the date range you select will depend on what information shows.
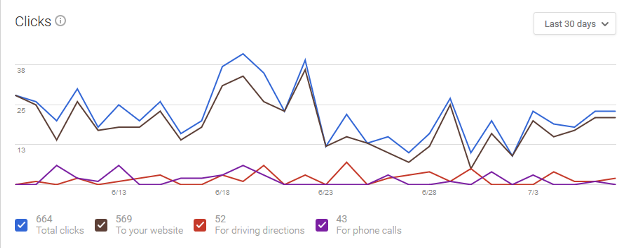
This is then broken down into 4 sub sections;
Total Clicks – This is the total amount of clicks you have received, whether to your website, for driving directions or for a phone call.
To Your Website – This is the number of clicks you have received to your website from results in Google Maps (desktop and mobile) and Google Searches.
For Driving Directions - This is the number of clicks you have received for driving directions from results in Google Maps (desktop and mobile) and Google Searches.
For Phone Calls - This is the number of clicks you have received for your phone number from results in Google Maps (desktop and mobile) and Google Searches.
Again this can be incredibly helpful to see how well your Google Business page is performing. You can then try and increase clicks each month and this can be done by making regular updates to your page.
Driving directions requests
This section helps to show where your driving requests have come from. Google will show a map with sections highlighted and these show where the driving requests have come from;
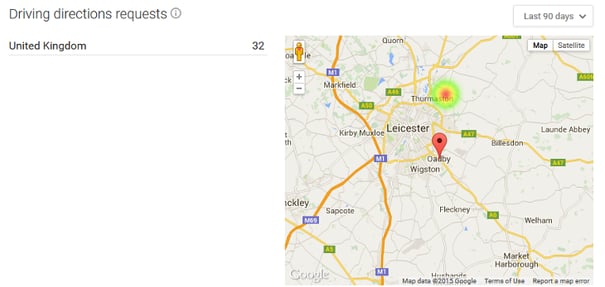
This can help as it can show where you're receiving driving directions requests from. So if you look on the map and see a certain area is much more highlighted than another area, it may be worth focusing some of your attention on this area as this may be where more of your customers come from.
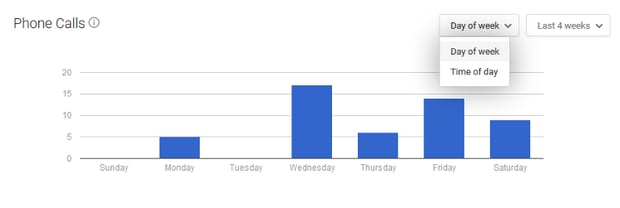
Phone Calls
The last section in Insights is phone calls, again if analysed in the right way can be massive for your business. Google allows you to see the number of clicks your phone number has had from results over different time periods. Not only are you able to see how many clicks you have had to call, but Google will also show you what day of the week they have come from and what time of the day they have come from. This again is brilliant data from Google as it means you can now see if there is a pattern to when you get the most calls. If you analyse the data and can see that at the beginning of the week is when you get most calls, you can then plan for this and be more prepared.
Conclusion
You need to make sure that you are frequently checking and analysing your Google My Business data and that you are taking notes on how you can improve it. The more time you are spending on this the better results you will get. There is no doubt about it, if you can take the time to review your page you will see the benefits.

Article by: Adam Jones