When we review a website as part of an inbound marketing audit, we look at what the website is actually producing for your business. We look at how many leads it’s creating, and also how many of those leads are converted into customers - and then how much actual revenue those customers bring.
We often review these numbers at the start of working with a client, and then we can track improvements as we go along. As a result, we’ve got a fair amount of data, including having stats on the average progress clients make when working with us.
What Does The Average Business Website Produce?
In this article we reviewed the progress of 41 businesses where we had conducted a full marketing audit. The average number of website visitors of those 41 companies was just over 700 visits to their website per month. They were generating an average of 16 leads/enquiries per month, so that means the average conversion rate was 2.3%.
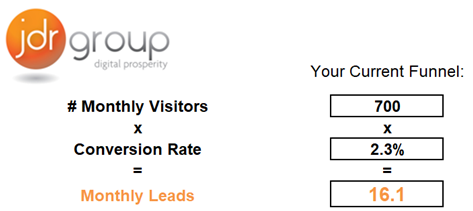
With a 2.3% conversion rate, 97.7% of users visiting your website leave and don’t interact with the site - but believe it or not, 2.3% is actually a pretty typical conversion rate. We often see worse!

Beyond The Enquiry: Converting Leads Into Sales
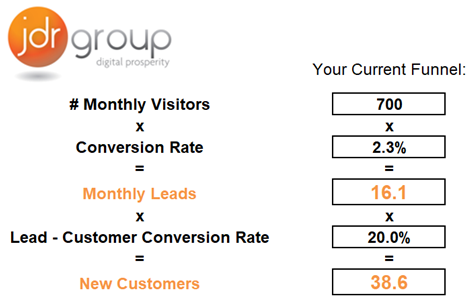
If you were to get 16 enquiries to your website - in other words, 16 people asking about your services, then it is fair to say they will not all buy from you. Some of those will be overseas/out of your territory, some you won’t be able to help/they will be asking you about services you don’t provide and for some when you tell them how much it’s going to cost, they won’t want to pay for it.
In other words, you won’t be able to convert all 16 leads into actual customers.
A fairly typical conversion rate is 20%, so 1 in 5 of those enquiries turning into new customers (this varies wildly depending on the business/industry/nature of service). If we use that as an example, then, if this was your website, you’d be getting 700 visitors per month, and 16 leads a month. If you convert 1 in 5 on average then this is just over 3 new customers a month - which means over the course of 12 months, your website is bringing you 38 new customers every year.
When we apply these numbers, your website funnel looks like this:
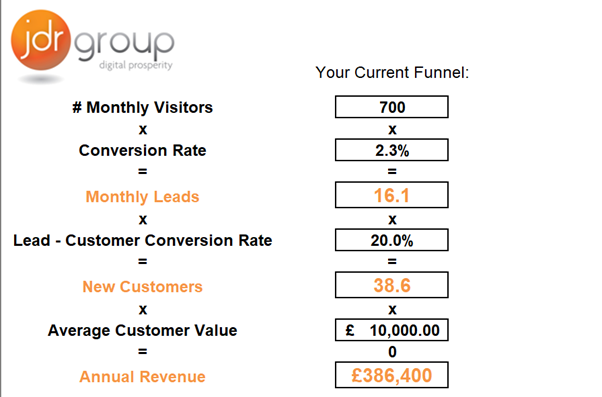
Including Revenue: The Full Website Funnel
Now, let’s say the average customer for your business spends £10,000 a year with you, then your website would be generating £386,400 of revenue every year. Here's the full funnel:
When we know what the existing funnel looks like, then you can start looking at making some improvements.
In this study we looked at before and after results with our clients over a twelve-month period: we saw average increases of 191% increase in website traffic, 654% increase in leads/enquiries, and a 159% increase in website conversion rate.
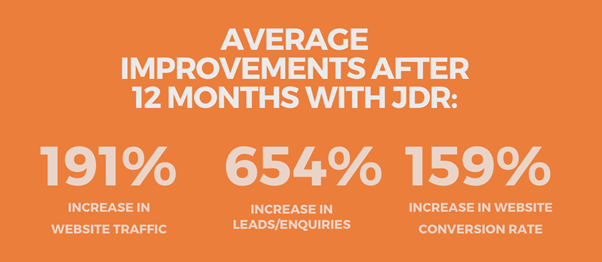
By increasing both website visitor numbers AND conversion rate, you see a huge increase in monthly leads/enquiries of 654%.
Applying JDR Group's Average Marketing Results
If we apply our average increases to your example website funnel, then over a 12-month period the average number of monthly website visitors go from 700 to 2037, the conversion rate jumps from 2.3 to 6.0% - which means your website is now getting 121 new leads/enquiries each month.
In this example, you are now gaining 291 new customers a year, instead of 38. Assuming the average customer spend remains the same so now the website is generating £2.9m a year. 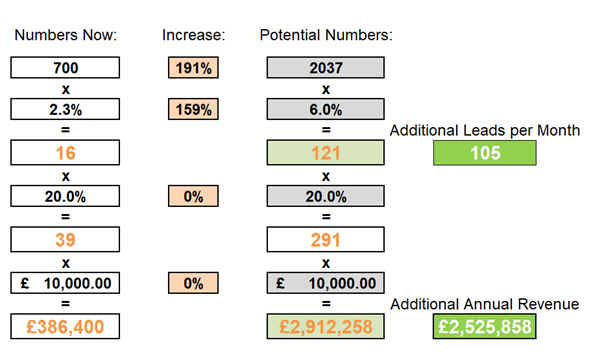
Increasing the number of monthly visitors AND conversion rate together has a huge impact and generates an extra £2,525.858 in annual revenue.
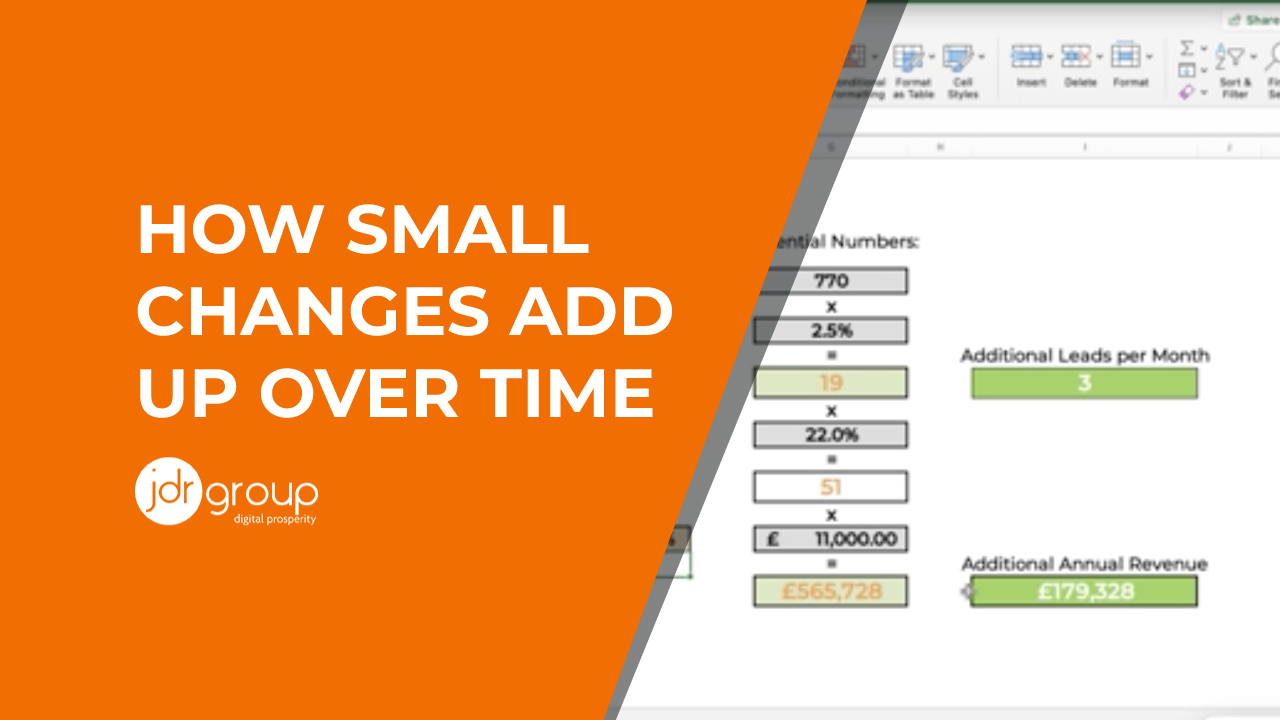
How Even Small Increases Make A Big Difference
It doesn’t need to be that dramatic, if you increase those two original figures by just 10%, as well as the lead – customer conversion rate and average customer value, which are very small increases, means that instead of your website generating £386,400 a year, it now generates £565,728 annually, which is almost a 50% increase in revenue, just by adding 10% to those four figures.
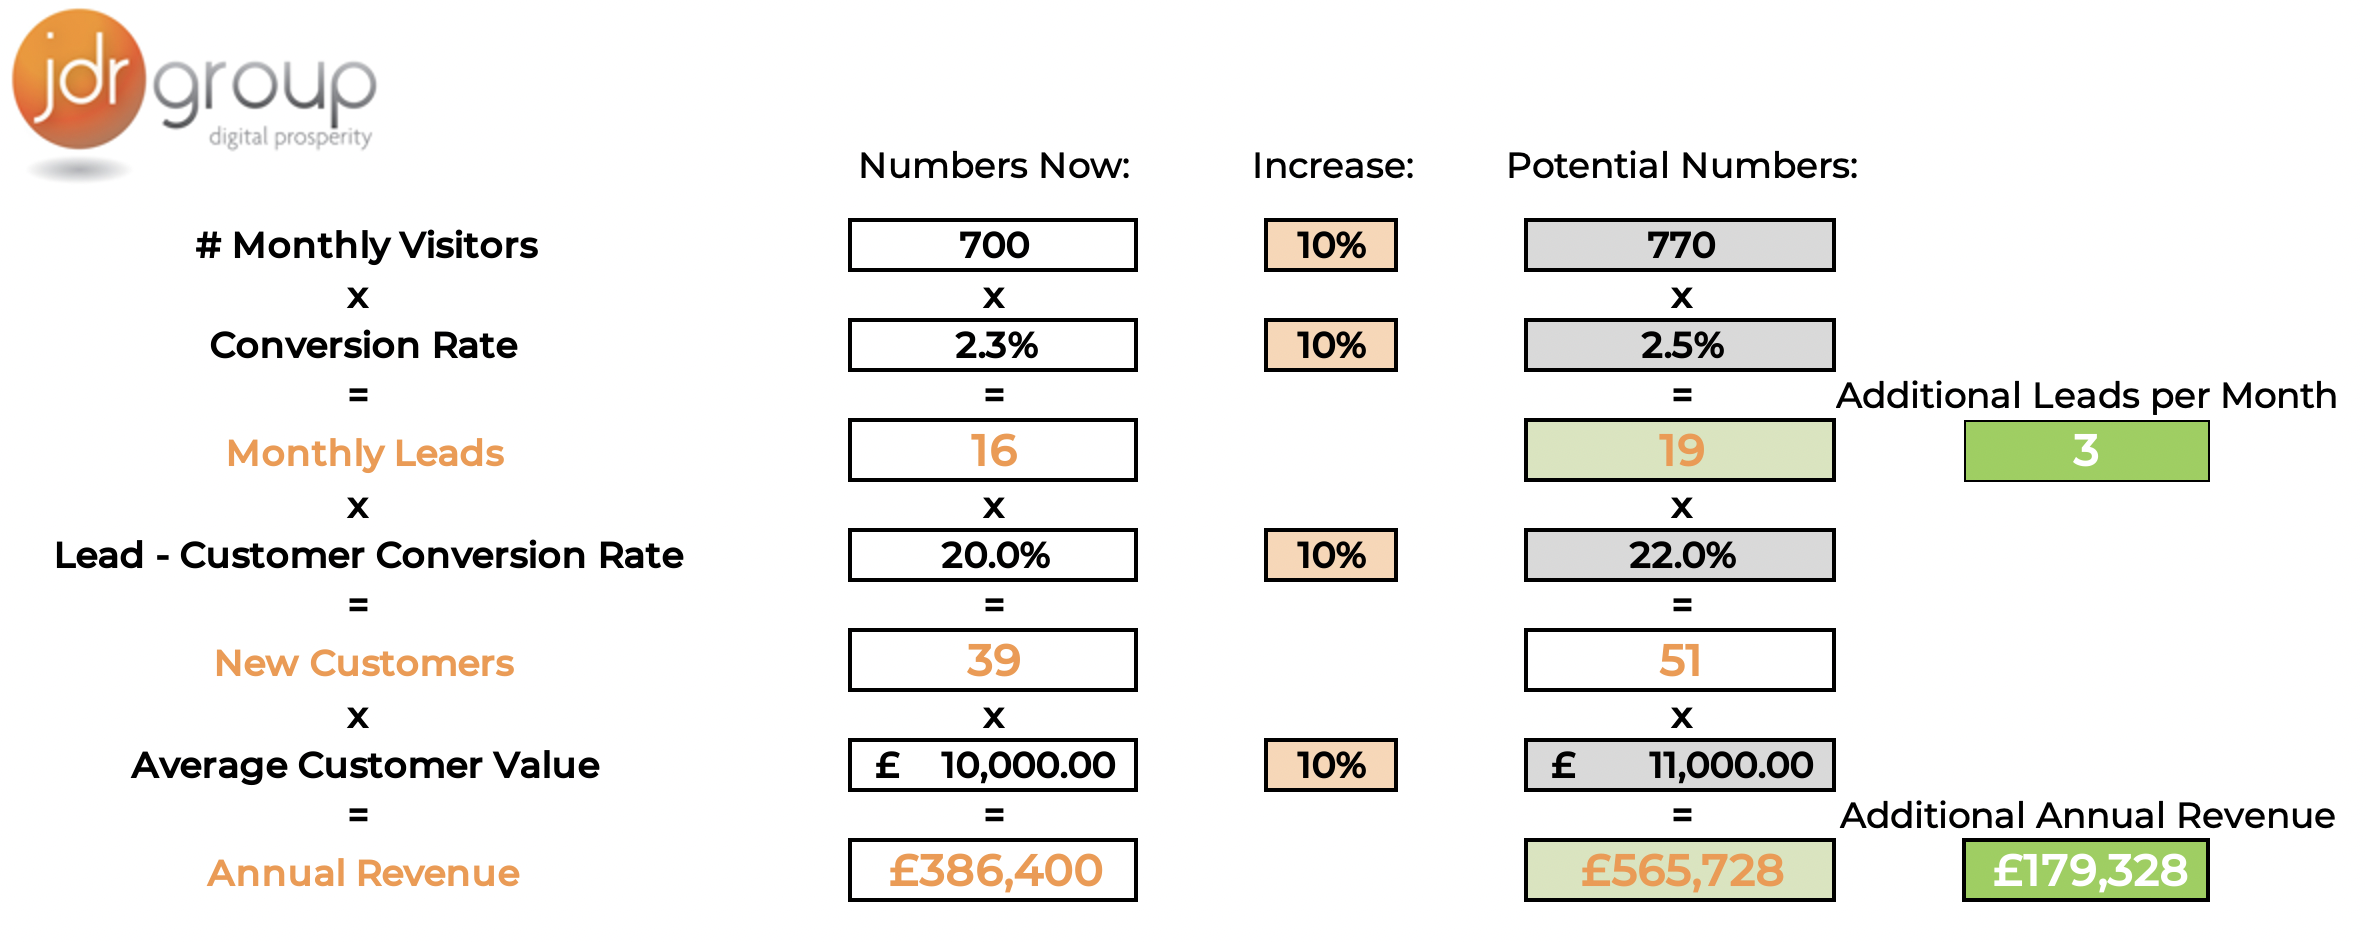
When you do that, obviously your revenue increases, but also you should those benefits rising exponentially, year-by-year. The key thing to take away from this article is that even if you only increase your marketing figures by small amounts, the benefits add up massively in the long run.
You can watch this video where we talk this concept through (also available on our YouTube Channel) - and if you'd like to have this analysis done on your site you can request a free inbound marketing audit.
How To Get More Leads From Your Website
We have surveyed hundreds of business owners, and the number one answer to the question 'what is your biggest sales challenge?' is a lack of leads. If you have the same challenge, then our guide, How To Get More Leads From Your Website is a great place to start - download your copy today.